

Why Observability Should Be the New Backbone of Full‑Stack Development
When I first started stitching together APIs, UI components, and databases, the mantra was “code fast, ship faster.” That mindset got us to market quickly, but it also left us with blind spots: latency spikes that appeared after a feature toggle, memory leaks that surfaced only under load, and user‑experience hiccups that were impossible to trace back to a single line of code. In today’s hyper‑competitive SaaS landscape, speed alone isn’t enough. The next competitive moat is observability‑driven full‑stack development—a disciplined approach that makes every layer of your application visible, measurable, and improvable.
From Logging to Telemetry: The Evolution of Insight
Traditional logging gave us a static snapshot: “User X clicked button Y.” It was useful, but it lacked context. Modern telemetry, on the other hand, bundles metrics, traces, and logs into a single, searchable narrative. When a request travels from the browser through a GraphQL gateway, hits a Node.js micro‑service, persists data in a PostgreSQL cluster, and finally triggers an email via a third‑party provider, telemetry stitches those hops together. The result is a live map of the request’s journey, highlighting latency at each hop and surfacing errors before they reach the end user.
Adopting telemetry isn’t a plug‑and‑play exercise. It requires:
- Instrumentation at every boundary—client SDKs, server middleware, database drivers, and even external APIs.
- Standardized data models so that a trace from a React component can be correlated with a span from an Express handler.
- Unified dashboards that surface both business‑level KPIs (conversion, churn) and technical health metrics (error rates, GC pauses).
Designing for Observability from Day One
Embedding observability into the architecture starts with a few guiding principles:
- Fail Fast, Report Faster—When a downstream service throws an exception, capture the error, enrich it with request identifiers, and surface it immediately.
- Correlation IDs Are Sacred—Generate a UUID at the edge (e.g., in a Cloudflare Worker) and propagate it through every layer. This ID becomes the thread that ties logs, metrics, and traces together.
- Semantic Monitoring—Move beyond “CPU usage 80%” to “checkout API latency > 300 ms for > 5 % of transactions.” Business‑oriented alerts reduce noise and improve response times.
By making these practices non‑negotiable, you create a culture where developers treat observability as code, not an afterthought.
Tooling the Full‑Stack Stack
Choosing the right stack for observability is as critical as picking the right language for your service. Here are a few categories and my go‑to picks:
Client‑Side Instrumentation
Modern JavaScript frameworks (React, Vue, Svelte) now ship with first‑class support for performance APIs that expose paint times, interaction latency, and resource loading. Coupled with an OpenTelemetry SDK, you can push these metrics straight to your backend without bloating bundle size.
Server‑Side Telemetry
On the API layer, OpenTelemetry agents for Node.js, Go, and Java automatically capture inbound requests, database queries, and outbound HTTP calls. Pair this with a tracing backend like Jaeger or Tempo, and you get end‑to‑end visibility.
Database Observability
PostgreSQL’s pg_stat_statements extension and MySQL’s Performance Schema provide query‑level latency data. Export these metrics to Prometheus, then set alerts for “slow query > 200 ms” to catch regressions before they affect users.
Infrastructure Monitoring
Even if you run on managed services, you still need to watch the underlying VMs, containers, or serverless functions. Cloud‑native metrics (CPU, network I/O) combined with custom health checks (e.g., “can’t connect to Redis”) give you a full picture of system health.
Bridging the Gap Between Front‑End and Back‑End Teams
Observability is the lingua franca that unites front‑end and back‑end engineers. When a UI slowdown is reported, the front‑end team can trace the request ID into the back‑end dashboard and see if the bottleneck resides in a database call, a third‑party API, or even a CDN edge node. Conversely, when a back‑end service spikes in latency, the front‑end team can simulate the problematic flow in a sandboxed environment, reducing time‑to‑resolution dramatically.
One practical technique is to embed “observability tickets” into your sprint planning. Every new feature or bug‑fix must include a step to verify that relevant metrics and traces are emitted correctly. This practice keeps the instrumentation debt low and ensures that new code never becomes a blind spot.
Case Study: A SaaS Platform’s Journey from Reactive to Proactive
Let’s walk through a hypothetical but realistic scenario. A B2B SaaS product that provides real‑time analytics to marketing teams was experiencing sporadic “data not loading” errors for a subset of customers. The support team could only see tickets after the fact, and the engineering team was hunting in logs for clues.
By introducing end‑to‑end tracing with correlation IDs, the team discovered that the issue originated in a third‑party data ingestion service that occasionally timed out. The trace highlighted a 5‑second gap between the ingestion API call and the response, causing the front‑end spinner to exceed its timeout threshold.
With this insight, the team took two actions:
- Implemented a retry‑with‑backoff strategy for the ingestion call, reducing the timeout error rate by 80 %.
- Adjusted the UI spinner timeout and added a graceful “data loading…” fallback, improving perceived performance.
The result? A 30 % drop in support tickets and a measurable increase in user engagement—proof that observability directly drives business outcomes.
Observability as a Driver of Architectural Decisions
When you can see the cost of every request, you make smarter trade‑offs. For example, you might discover that a GraphQL resolver is pulling in three separate REST services, each adding 50 ms of latency. Knowing this, you can refactor the resolver to batch those calls or cache the result, shaving off 150 ms per request.
Similarly, observability can inform your choice between a monolith and micro‑services. If traces consistently show high inter‑service latency, it may be time to consolidate certain services or move to a more efficient communication protocol (gRPC, HTTP/2).
Future‑Proofing with AI‑Assisted Observability
AI is creeping into every corner of the dev stack, and observability is no exception. Modern platforms now offer anomaly detection powered by machine learning, automatically flagging deviations from normal latency patterns. Some even generate root‑cause suggestions by correlating recent code changes with observed metric shifts.
While AI‑augmented observability isn’t a silver bullet, it can dramatically reduce MTTR (Mean Time to Recovery) by surfacing the most likely culprits within seconds of an incident. Pair this with a robust alerting strategy, and you have a self‑healing ecosystem that keeps your SaaS product humming.
Getting Started: A Practical Checklist
If you’re ready to make observability a first‑class citizen, follow this checklist:
- Define Service‑Level Objectives (SLOs) for latency, error rate, and availability.
- Instrument every entry point—browser, API gateway, background jobs.
- Standardize correlation IDs across all services and third‑party calls.
- Set up a centralized tracing backend (Jaeger, Tempo, or a managed SaaS solution).
- Export metrics to a time‑series database (Prometheus, InfluxDB).
- Create dashboards that blend business KPIs with technical metrics.
- Configure alerts on SLO breaches, not just raw thresholds.
- Integrate observability checks into your CI/CD pipeline.
- Educate the entire team on reading traces and dashboards.
- Iterate and refine—observability is a journey, not a destination.
Conclusion: Observability as a Competitive Advantage
Full‑stack development has moved beyond “build it and pray.” In an era where users demand instant, reliable experiences, the ability to see inside your stack in real time is a decisive differentiator. By making observability a core pillar of your development process, you empower teams to ship faster, debug smarter, and continuously optimize the user journey.
If you’re curious about how low‑level performance enhancements can complement observability, check out WebAssembly Meets SaaS. And for a deeper dive into why JavaScript remains the connective tissue of modern architectures, see Why JavaScript Is Becoming the Glue for Edge‑First Architectures. Both pieces illustrate how a solid observability foundation can amplify the impact of cutting‑edge technologies.

Dale Peterson is a freelance writer with a passion for technology, travel, law and personal finance. With 10 years of experience crafting compelling and informative content, he's dedicated to delivering high-quality writing for Blogging Fusion that engages audiences and achieves specific goals.
Related Posts
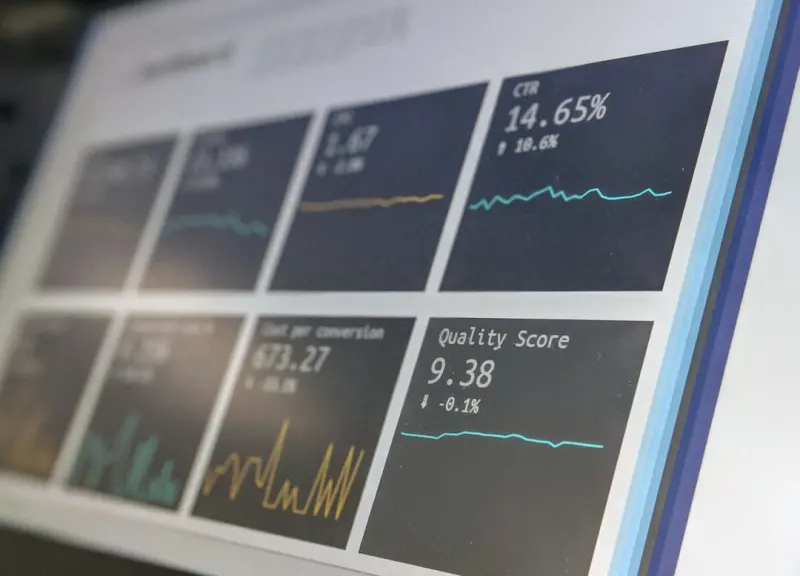
Full-Stack Observability: Turning Data into Real-Time Insight for SaaS Teams
Observability transforms raw logs, metrics, and traces into a unified map of your application, enabl... Read More

Feature Flags and Incremental Delivery: A Full‑Stack Playbook
Feature flags let full‑stack teams ship, test, and roll back changes instantly, reducing risk and ... Read More

Monorepo Mastery: Unleashing Full‑Stack Velocity for Modern SaaS Teams
A single repository can streamline type sharing, feature flag management, and observability, turning... Read More
Top Posts

Event‑Driven Architecture: The Competitive Edge SaaS Teams Are Missing
This post explains why moving from monolithic request‑response models to event‑driven architecture gives SaaS companies faster experiments, higher resilienc...Read More
WebAssembly & Micro‑Frontends: A Pragmatic Blueprint for Mobile Web Performance
Explore how WebAssembly combined with micro‑frontend design can deliver near‑native speed on mobile browsers, with actionable guidance on lazy loading, perf...Read More

Unlocking Drupal’s Decoupled Potential for Enterprise Digital Hubs
This article examines why enterprises are adopting a decoupled Drupal strategy, highlighting multilingual capabilities, configuration‑as‑code, CI/CD pipelin...Read More

Why Headless WordPress Themes Are the Next Frontier for Enterprise Sites
Headless WordPress themes separate content from presentation, delivering faster load times, omnichannel consistency, and scalability for enterprise sites. This ...Read More
0 Comments
Post Comment
You will need to Login or Register to comment on this post!