
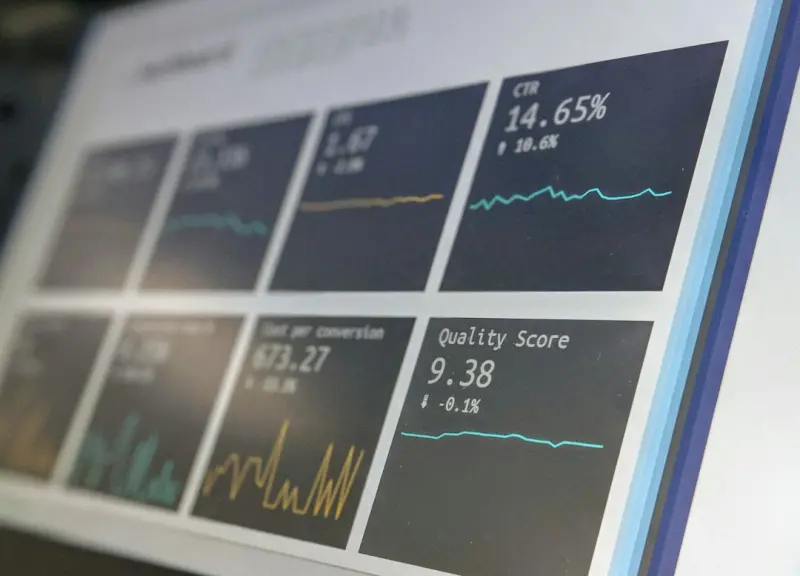
Why Full‑Stack Observability Is the New Competitive Edge for SaaS
When I first transitioned from a pure front‑end role to the chaotic world of full‑stack engineering, I thought I’d finally reached the summit of complexity. Little did I know that the real mountain lay hidden beneath the code: observability. In the SaaS universe, where a single millisecond of latency can translate into churn, a unified view of what’s happening across every layer—from the browser to the data plane—is no longer a nice‑to‑have; it’s a survival skill.
Full‑stack observability is the art and science of turning raw telemetry into actionable insight. It stitches together metrics, distributed traces, logs, and even business KPIs into a single narrative, allowing teams to answer three critical questions in real time: What is happening?Why is it happening? and What should we do about it? This post explores how to build that narrative from the ground up, how to align it with modern development practices, and why it matters more than ever in a landscape crowded with micro‑frontends, edge‑first deployments, and serverless functions.
From Reactive Debugging to Proactive Insight
Traditional monitoring gave us alerts when something broke. Observability flips the script: it equips us with the context needed to predict and prevent failures. Think of it as moving from a fire alarm that screams when the building is already ablaze to a sensor network that detects a spark before it catches fire.
- Metrics give you the quantitative health of your system—CPU usage, request latency, error rates.
- Traces map the journey of a request across services, revealing hidden bottlenecks.
- Logs provide the narrative detail—stack traces, debug statements, and business events.
- Business KPIs (conversion, churn, revenue per user) close the loop, tying technical performance to real‑world outcomes.
When these data streams converge, you gain a holistic view that lets you answer “Why did the checkout latency spike at 2 AM?” without opening a dozen dashboards.
Designing a Unified Observability Stack
Building an observability platform is not about buying the flashiest vendor. It’s about constructing a pipeline that respects the realities of your stack. Here’s a pragmatic roadmap:
- Instrument at the Edge—If you’re already experimenting with an edge‑first full‑stack approach, embed lightweight tracing agents in your CDN workers and serverless functions. Edge telemetry gives you the earliest signal of latency or error before the request even reaches your origin.
- Standardize Data Formats—Adopt OpenTelemetry as the lingua franca. It works across languages, supports metrics, traces, and logs, and prevents vendor lock‑in.
- Centralize Storage—Use a time‑series database for metrics (e.g., Prometheus), a trace storage like Jaeger or Tempo, and a log index such as Elasticsearch. Ensure they can be queried together via a unified UI or API.
- Correlate with Business Events—Push key business events (e.g., “user signed up”, “invoice generated”) into the same pipeline. This lets you overlay technical health on revenue curves.
- Automate Alerting—Define Service Level Objectives (SLOs) that tie latency or error budgets to business outcomes. Alert on SLO breach, not just raw metric thresholds.
Choosing the Right Tooling Without Over‑Engineering
It’s tempting to stack every observability product on the market, but the law of diminishing returns applies. Start small:
- Metrics: Prometheus + Grafana for on‑prem, or a managed service like CloudWatch for serverless workloads.
- Traces: OpenTelemetry SDKs + a lightweight collector; store in Tempo if you’re already on Grafana Cloud.
- Logs: Fluent Bit to ship logs to Loki; Loki integrates seamlessly with Grafana, keeping the UI consistent.
- Correlation: Use a “trace ID” that propagates through logs and business events, making cross‑stream queries trivial.
Remember, the goal is visibility, not a perfect replica of every possible signal. Prioritize the data that directly impacts your customers and your business goals.
Integrating Observability with Existing Architecture
If you’re still running on a single virtual private server (VPS) to host multiple tenants, you can’t afford blind spots. The VPS playbook highlights the importance of isolation, but it also reminds us that resource contention can be a silent killer. By instrumenting each tenant’s request path, you can quickly pinpoint whether a CPU‑hungry tenant is throttling the entire system.
For responsive UI layers, CSS container queries enable components to adapt without constant JavaScript re‑calculations. When you combine that with front‑end performance metrics (First Contentful Paint, Time to Interactive), you get a full picture: the back‑end served the request in 120 ms, but the UI took an extra 300 ms to render due to CSS re‑flow. Observability helps you locate those hidden performance cliffs.
Culture: Making Observability a Team Sport
Technical tooling only shines when the team embraces a culture of curiosity. Here are three habits that embed observability into daily workflows:
- Post‑mortem as a Learning Loop—After every incident, conduct a blameless post‑mortem that highlights which signals were missed and how to surface them earlier.
- Shift‑Left Debugging—Encourage developers to write unit‑level traces and log statements before code lands in production. Treat observability as part of the definition of done.
- Dashboard Ownership—Assign each service a “dashboard champion” who ensures the visualizations stay relevant and that alerts are properly tuned.
When the whole organization treats telemetry as a shared language, you turn data into a decision‑making superpower rather than a collection of siloed metrics.
Case Study: A Hypothetical SaaS Billing Platform
Imagine a SaaS that processes millions of subscription payments each month. The engineering team recently migrated their payment gateway to a serverless function at the edge, expecting lower latency. After launch, churn spiked by 1.2 %—a small number but financially significant.
Using a unified observability stack, the team discovered three critical insights:
- Metrics showed a sudden increase in
5xxerrors from the payment provider during peak traffic. - Distributed traces revealed that the edge function was retrying the call three times before timing out, adding an average of 800 ms per transaction.
- Business KPI correlation indicated that failed payments directly matched the churn spike.
Armed with this data, the team implemented exponential back‑off and circuit‑breaker logic, reduced average payment latency to 150 ms, and saw churn return to baseline within two weeks. This example underscores how observability transforms a vague “something broke” into a concrete, fixable problem.
Best Practices Checklist
- Tag Every Request with a unique trace ID that propagates through logs, metrics, and business events.
- Sample Strategically—collect full traces for high‑value transactions, while using rate‑limited sampling for bulk traffic to control storage costs.
- Define Service Level Indicators (SLIs) that map technical health to user experience (e.g., 99 % of API calls under 200 ms).
- Automate SLO Breach Alerts and route them to the appropriate on‑call team via PagerDuty or Opsgenie.
- Document Instrumentation in the codebase—README sections that explain why a particular metric exists and how to interpret it.
- Review Dashboards Quarterly to prune stale panels and add new ones as the product evolves.
Looking Ahead: Observability as a Competitive Moat
As SaaS products become more distributed—leveraging edge compute, serverless back‑ends, and third‑party APIs—the signal‑to‑noise ratio worsens. Companies that invest in a robust, unified observability strategy will not only reduce mean time to resolution (MTTR) but also gain a strategic advantage: they can experiment faster, release confidently, and iterate based on data‑driven insights rather than gut feeling.
In my experience, the most successful teams treat observability as a product in its own right, complete with roadmaps, versioning, and user feedback loops. When you do that, you turn a monitoring cost center into a revenue‑generating engine.
Full‑stack observability isn’t a one‑time project; it’s an ongoing journey of instrumentation, analysis, and cultural reinforcement. Start small, iterate fast, and let the data guide you toward a more resilient, performant, and delightful SaaS experience.

Sanji Patel has dedicated 25 years to the SEO industry. As an expert SEO consultant for news publishers, he emphasizes providing both technical and editorial SEO services to news publishers worldwide. He frequently speaks at conferences and events globally and offers annual guest lectures at local universities.
Related Posts

Full-Stack Observability: Turning Data Into Seamless User Experiences
A deep dive into building full-stack observability pipelines that connect server logs, API traces, a... Read More

Feature Flags and Incremental Delivery: A Full‑Stack Playbook
Feature flags let full‑stack teams ship, test, and roll back changes instantly, reducing risk and ... Read More

When Full‑Stack Meets AI: Crafting Smarter SaaS Pipelines
Dale Peterson shares a practical, AI‑first workflow for full‑stack teams, blending serverless, f... Read More
Top Posts
Full-Stack Observability: Turning Data Into Seamless User Experiences
A deep dive into building full-stack observability pipelines that connect server logs, API traces, and UI metrics, giving developers the insight needed to deliv...Read More

When jQuery Still Makes Sense for SaaS Teams
A practical look at why jQuery remains useful in certain SaaS scenarios, best practices for its safe integration, and guidance on when to transition to modern f...Read More
Building a Future‑Ready SaaS Knowledge Base with Drupal
Drupal’s robust content modeling, multilingual support, and seamless DevOps integration turn it into a strategic knowledge hub for SaaS companies, enabling sc...Read More
Zero‑Trust for SaaS: Security That Moves at the Speed of Your Product
Zero‑trust turns security into a product feature, not a roadblock. This guide walks through identity‑centric access, micro‑segmentation, policy‑as‑cod...Read More
0 Comments
Post Comment
You will need to Login or Register to comment on this post!