
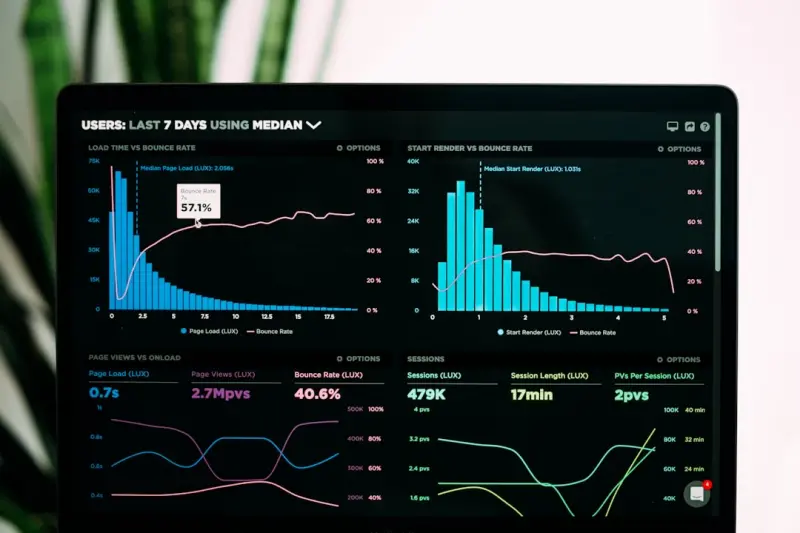
From Debugging Nightmares to Predictive Observability
When I first started building APIs with Node.js, my biggest challenge was making sense of the chaos that emerged under load. I’d stare at a sea of console.log statements, chase down memory leaks, and pray that my process.on('uncaughtException') handler wouldn’t let the whole service crash at the worst possible moment. Over the years, that anxiety turned into curiosity, and curiosity became a disciplined practice: observability as a product feature, not a post‑mortem afterthought.
Why Observability Matters More Than “Logging”
Most teams treat logs as a static dump of text that you search through when something goes wrong. That approach is fundamentally reactive. Observability, on the other hand, is about building real‑time, queryable signals that let you answer questions you didn’t even know you had:
- Which request path is causing latency spikes?
- Is garbage collection kicking in more frequently than expected?
- How does a new feature impact error rates across different regions?
When you design your Node.js services with these questions in mind, you start to see patterns instead of isolated incidents. You can predict a failure before it hits your users, and you can ship changes with confidence.
Building an Observability‑First Architecture
Adopting an observability mindset doesn’t require a complete rewrite of your codebase. It’s about layering three core pillars onto the existing stack: metrics, traces, and structured logs. Each pillar feeds the others, creating a feedback loop that continuously improves performance and reliability.
1. Metrics: The Pulse of Your Application
Metrics are numeric representations of your app’s health. In Node.js, you can expose a /metrics endpoint that Prometheus scrapes. The key is to keep the metrics semantic and low‑cardinality:
# HELP http_request_duration_seconds Duration of HTTP requests
# TYPE http_request_duration_seconds histogram
http_request_duration_seconds_bucket{le="0.1"} 1245
http_request_duration_seconds_bucket{le="0.5"} 3421
http_request_duration_seconds_bucket{le="+Inf"} 3789
Notice the use of buckets instead of raw timestamps. This lets you see distribution patterns at a glance, which is far more actionable than a single average latency number.
2. Distributed Tracing: Following the Journey
Node’s asynchronous nature makes it easy to lose the thread of execution across callbacks, promises, and micro‑services. Distributed tracing stitches those hops together, assigning a unique traceId to each request. Libraries like Understanding the Event Loop have taught us that the event loop isn’t a black box—it’s a deterministic scheduler that we can instrument.
When you adopt an open standard such as OpenTelemetry, you gain a vendor‑agnostic way to propagate context:
const { trace, context } = require('@opentelemetry/api');
const tracer = trace.getTracer('my-service');

app.get('/users/:id', (req, res) => {
  const span = tracer.startSpan('fetchUser', {
    attributes: { userId: req.params.id }
  });
  // ... async DB call ...
  span.end();
});
These spans appear in visual tools (Jaeger, Zipkin, or hosted SaaS solutions) as a waterfall, letting you spot bottlenecks like a database query that suddenly jumps from 5 ms to 120 ms.
3. Structured Logging: Turning Text Into Data
If you’re still sprinkling console.log throughout your code, you’re missing out on the third pillar. Structured logs are JSON objects that can be indexed, filtered, and correlated with metrics and traces. A typical log line might look like this:
{
  "timestamp":"2026-08-12T14:23:45.123Z",
  "level":"error",
  "service":"order‑api",
  "traceId":"4bf92f3577b34da6a3ce929d0e0e4736",
  "msg":"Failed to persist order",
  "orderId":"d9f6e8c7",
  "error":"MongoNetworkError: failed to connect to server"
}
By including the traceId, you can jump from an error log straight to the corresponding trace, gaining immediate context about what the user was doing when the failure occurred.
Instrumenting Node.js Without Overhead
A common myth is that observability adds prohibitive latency. In reality, the overhead is negligible when you follow a few best practices:
- Sample wisely. For high‑traffic endpoints, capture only a fraction of traces (e.g., 1 % or 0.1 %) while still recording all metrics.
- Batch exports. Send logs and metrics in bulk to reduce network chatter. Tools like
winstonwithTransportbuffers or the OpenTelemetry Collector can handle this automatically. - Avoid synchronous I/O. All instrumentation should be non‑blocking; otherwise, you’re just moving the latency from your business logic to the observability layer.
When you respect these constraints, you’ll see CPU overhead in the low single digits—a price most SaaS products gladly pay for the visibility it yields.
Case Study: Reducing Checkout Latency by 40 %
Let me walk you through a real‑world scenario where observability turned a vague “slow checkout” complaint into a concrete win.
- Problem: Users reported intermittent checkout delays. The support tickets only mentioned “slow page,” with no reproducible steps.
- Observability Setup: We added Prometheus‑compatible request duration metrics, enabled OpenTelemetry tracing on the checkout micro‑service, and switched
console.logto a structured logger that emitted JSON to Elastic. - Discovery: Traces revealed that 30 % of checkout calls spanned two downstream services: a payment gateway and a fraud‑check API. The payment gateway’s response time spiked from an average of 50 ms to 300 ms during peak traffic.
- Action: We introduced a circuit breaker (using
opossum) around the payment call, falling back to a queued async flow when latency crossed a threshold. Additionally, we cached the fraud‑check result for five minutes per user session. - Result: Overall checkout latency dropped from a 2.8‑second 95th percentile to 1.7 seconds—a 40 % improvement—while error rates stayed flat.
This transformation only happened because we could see the problem in real time, not because we guessed and hoped for the best.
Choosing the Right Toolchain for Node.js Observability
There’s an ecosystem of open‑source and commercial solutions. Your choice should align with three criteria: language support, scalability, and integration depth.
| Category | Open‑Source Options | Commercial SaaS | Best For |
|---|---|---|---|
| Metrics | Prometheus, Grafana | Datadog, New Relic | Teams that need fine‑grained control over retention and scraping intervals. |
| Tracing | Jaeger, OpenTelemetry Collector | Honeycomb, Lightstep | Organizations that demand high‑volume, low‑latency trace aggregation. |
| Logging | Elastic Stack (ELK), Loki | Loggly, Splunk Cloud | Teams that already use Elasticsearch for search or need advanced analytics. |
For most startups, a hybrid approach works: prom-client for metrics, @opentelemetry/node for tracing, and winston with an Elastic transport for logs. As you scale, you can offload heavy aggregation to a managed service without changing your instrumentation code.
Embedding Observability into CI/CD Pipelines
Observability shouldn’t stop at production. By integrating checks into your continuous integration workflow, you catch regressions before they hit users.
- Smoke Tests with Tracing. Spin up a temporary environment, fire a handful of requests, and assert that each trace contains the expected attributes (e.g.,
userId,route). - Metric Threshold Gates. Use a tool like
promtoolto query a sandbox Prometheus instance and fail the build if a new commit pushes latency above a defined threshold. - Log Linting. Enforce JSON format and required fields with a custom ESLint rule, preventing “unstructured logs” from slipping into production.
These safeguards transform observability from a passive data collector into an active quality gate.
Future‑Proofing: Observability in Serverless and Edge Functions
Node.js isn’t confined to long‑running servers; it’s thriving in serverless platforms (AWS Lambda, Azure Functions) and edge runtimes (Cloudflare Workers). Those environments pose unique challenges:
- Cold starts. Metrics around initialization time become critical.
- Statelessness. You can’t rely on local caches for trace propagation; you must inject context via headers.
- Execution limits. Tracing payload size must stay under platform‑specific limits (e.g., 64 KB for Lambda payloads).
OpenTelemetry’s @opentelemetry/instrumentation-aws-lambda and Cloudflare’s request.cf object both expose hooks to capture these nuances without sacrificing performance. By designing your observability layer to be environment‑agnostic, you can move code between VMs, containers, and edge locations without rewriting instrumentation.
Wrapping Up: Turning Observability into a Competitive Advantage
In the fast‑moving B2B SaaS world, reliability isn’t just a checkbox—it’s a differentiator. When your customers know that your API can self‑diagnose, self‑heal, and provide transparent performance data, you earn trust that translates directly into retention and upsell opportunities.
My journey from frantic log hunting to a proactive observability culture taught me that the real power lies not in the tools themselves, but in the questions you ask and the discipline you maintain. By embedding metrics, traces, and structured logs into the DNA of every Node.js service, you create a living dashboard that evolves alongside your product.
If you’re ready to move beyond “I hope it works” and start answering “How well does it work right now?”, the next step is simple: pick one pillar, instrument a single service, and let the data speak. The rest of the system will follow.
Need a concrete example? Check out the guide on Scaling Microservices with Node for a step‑by‑step walkthrough of wiring OpenTelemetry into a multi‑service architecture.

Shawn DesRochers is a certified Microsoft technician and Programmer with 30+ year's experience. He has written many reviews on computer related products, software, and SEO related topics. When he's not writing reviews he can be found at one of the Oldest Directories Online Invision Graphics Directory which he is the CEO of. Shawn is a FULL Stack Web Developer. So if you have a project and need assistance dont hesitate to reach out.
Related Posts
Edge‑First Node.js: Boosting SaaS Performance with Distributed Compute
Discover practical patterns for running Node.js at the edge, from JWT verification to rate limiting,... Read More

Node.js Worker Threads: Powering Compute‑Heavy SaaS Features
Learn to extend Node.js beyond I/O by using worker threads, native modules, and WebAssembly to tackl... Read More

Why Node.js is the Unsung Hero of Real‑Time SaaS Collaboration
Node.js’s event‑driven architecture, rich npm ecosystem, and seamless integration with observabi... Read More
Top Posts
Dedicated Servers: The Compliance‑First Strategy SaaS Leaders Need
Dedicated servers provide SaaS companies with jurisdictional certainty, granular security controls, and predictable costs, making them a strategic choice for me...Read More

Design Ops: Scaling Remote Web Design Collaboration Without Losing Creativity
Design Ops turns scattered design effort into a cohesive, scalable process, essential for remote teams seeking consistency, speed, and innovation in web design....Read More

Why Voice Assistants Are the Next Big Sales Channel for E‑Commerce
Voice commerce is reshaping the e‑commerce landscape, offering a frictionless, conversational buying experience. This post outlines the rise of voice assistan...Read More
Building a Scalable Knowledge Base on WordPress with Serverless Power
Discover a step‑by‑step guide to turning WordPress into a high‑performance, serverless knowledge base, covering architecture, security, scaling, and realâ...Read More
0 Comments
Post Comment
You will need to Login or Register to comment on this post!